

Fast Food Fun
Objective: Use the Internet and spreadsheets to analyze the nutritional value of a typical fast food meal.
Step 1: Nutritional Information
Read this information from TeensHealth to learn what makes a meal healthy. Pay close attention to the part of the article that explains how many calories we should get from fat in our meal. We will be using this information to create charts that will help us evaluate how healthy our meal is.
Now use this handy nutrition calculator to determine how many calories you need each day. Once you have determined how many you should consume in a day, be sure to write it down in your Tech Journal so you don't forget it.
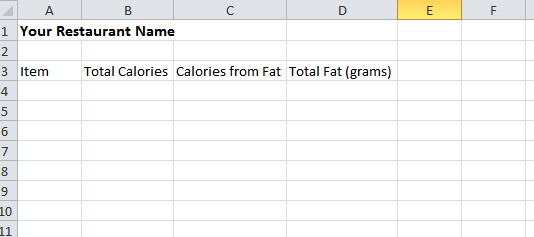
Step 2: Create a Table to Record Information
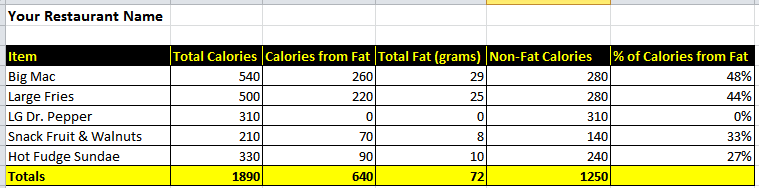
Open up Microsoft Excel and create a table with headings that looks like this:
Save your spreadsheet in your Documents folder. Call it YOUR NAME FFF.
Keep this table open so you can record data into it as you create your meal in Step 3.
Step 3: Create and Record Your Meal
Decide which fast food restaurant you would like to visit. Click on that restaurant's web site below. Once there, create a meal with a sandwich, salad or other main dish, a side dish (french fries, etc), a drink, and a dessert. For each item on your menu, record the total calories, the calories from fat, and the total grams of fat in the table you created in Step 2.
Your meal must contain at least five (5) items!
 McDonald's |
 Arby's |
 Wendy's |
 Subway |
 Carl's Jr. |
 Taco Bell |
Step 4: Calculate Information
Now that you have the basic information for your fast food meal, we are going to use the Math functions in Excel to calculate two more important pieces of data about your meal. Use the tabs below to complete each step
- 1. Add Headers
- 2. Caculate Non-Fat Calories
- 3. Calculate Percentage
- 4. Col. Totals
- 4. Percent Total
Add Column Headers
Using the illustration below as a guide, add two more column headers to your spreadsheet.
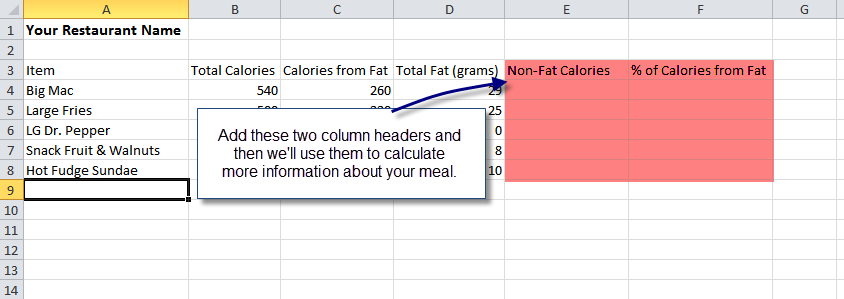
Now let's have Excel do some Math for us!
Calculate the Non-Fat Calories
First we'll calculate how many NON-FAT CALORIES are in each item of your meal. The math for this is:
So, we need to subtract the number in cell C4 from the number in cell C3. The formula will look like this:
Use the fill down function to quickly calculate the rest of your charts. |

Calculate Percent of Calories from Fat
Our next calculation will make it very easy for you to see how many calories in your meal come from fat. Think back to the reading in the first step where you learned what percentage of calories in any healthy food should come from fat. You'll soon see why this calculation will help you analyze the health of your meal.
The math for this calculation is: In Excel the function looks like this:
|

After we calculate the number, we have to change the number format of the cell to percentage so it is displayed in the correct format.
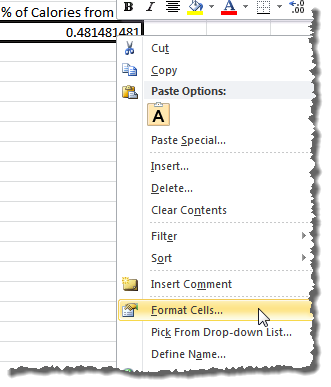 |
FIRST, right click the cell and select Format Cells from the pop-up menu. |
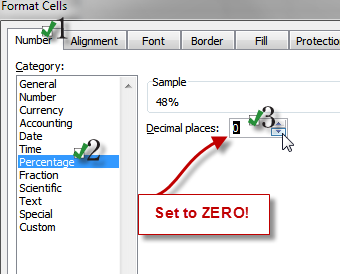 |
NEXT, follow the steps below:
|
Calculate Column Totals
The last set of calculations you'll need to do is total your columns. Do the following for every column except the Percentage from Fat column.
| First, select the cell under the column you wish to total up. | 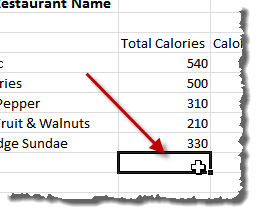 |
Second, click the Autosum button on the Ribbon (Home tab). | 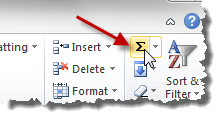 |
| Third, make sure the range of cells is correct. Look for the dotted lines and make sure it includes the whole range of cells! | 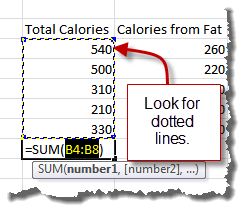 |
Fourth, press enter to lock in the function and see the total. | 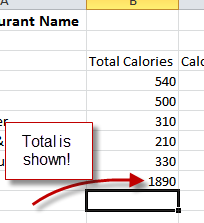 |
After you have done this for each of your columns, your spreadsheet should look similar to the following (you'll see I've also formatted my table):
Click the last tab in this section to learn how to calculate the % of Calories from Fat column total. It can only be completed after you have finished the other column totals.
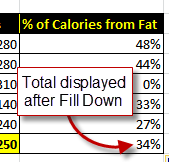
Calculate Percentage Total
The following steps help you calculate the percentage total.
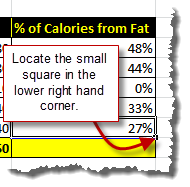 |
Then locate the small square in the lower right hand corner of the cell. |
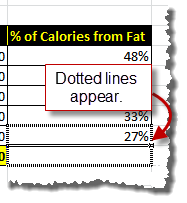 |
Release the mouse when you see the dotted lines around both cells. |
 |
|
Step 5: Create Your Charts
Charts help us quickly see and process information visually. This is important as you try to convince people of the nutritional value of your meal.
Your final product must include at least two charts. Use the tabs below to learn how to create a bar chart and a pie chart. See several other sample charts you might also want to create.
- Bar Chart
- Pie Chart
- Other Chart Samples
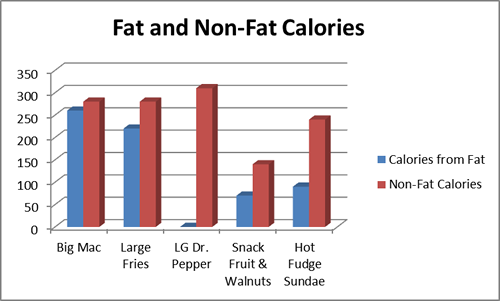
Creating a Bar Chart Comparing Fat and Non-Fat Calories
Bar charts are useful when comparing the same thing in many different things. In this chart, you will use a bar chart to compare the fat and non-fat calories of each item on your menu. You can then quickly spot the choices that aren't healthy and point them out to your audience.
![]() Click to watch the video explaining how to create this chart.
Click to watch the video explaining how to create this chart.
When you have completed this chart it should be similar to the following:
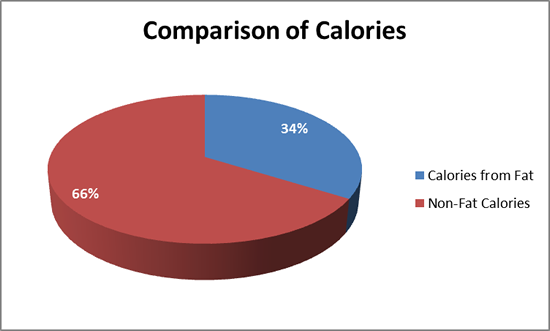
Creating a Pie Chart to Compare Total Calories from Fat and Non-Fat
Pie charts are useful when you want to show how the different parts of a whole compare to each other. In this chart we will compare the calories from fat and the calories that are non-fat and see how they compare to total calories. We know that in a healthy meal the calories from fat should be less that 35%, so this chart will very quickly reveal the nutritiousness of this meal.
![]() Click to watch the video explaining how to create this chart.
Click to watch the video explaining how to create this chart.
When you have completed this chart it should be similar to the following:
Other Chart Examples
Here are a few other sample charts you can create. Use the techniques learned to create the bar and pie charts in the other tabs of this section as you create these!
Chart 3
This chart uses a doughnut chart to show how many calories each item has compared to the calories in the whole meal. You can quickly see that most of the calories come from the Big Mac and the fries! We also finally see that while the Dr. Pepper may not have much fat, it sure does pack some calories!
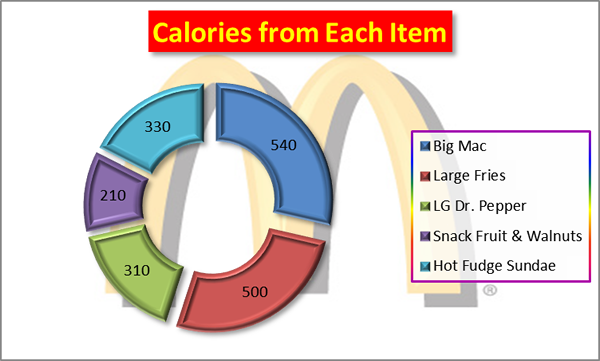
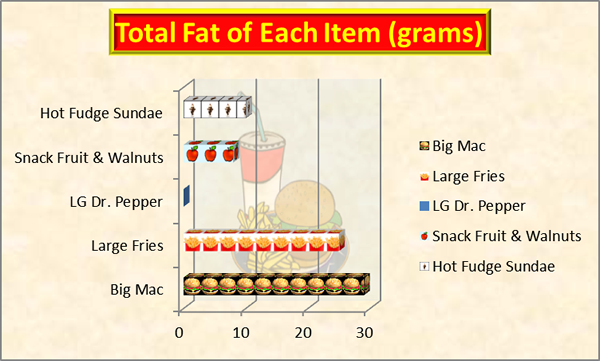
Chart 4
This chart uses the bar chart, which is very similar to the column chart to show the total grams of fat in each item. I used pictures of each item to make a stacked pictorial chart to add interest. This chart continues to point out that the Big Mac and the fries are the least healthy selections in this meal.
Step 6: Put It All Together
When your project is complete, it will include the following elements:
| The name of your restaurant. | |
| A nicely formatted table with each menu item and the following information about each:
Your table must include a row that totals each column as well. |
|
| At least one logo or graphic from your restaurant. | |
| At least two charts that help you justify the nutritious value of your meal. | |
| A three or four sentence paragraph that explains why your meal is healthy or not healthy. You must use data from your spreadsheet to justify your explanation! | |
| YOUR NAME! Be sure to take credit for your work!! |
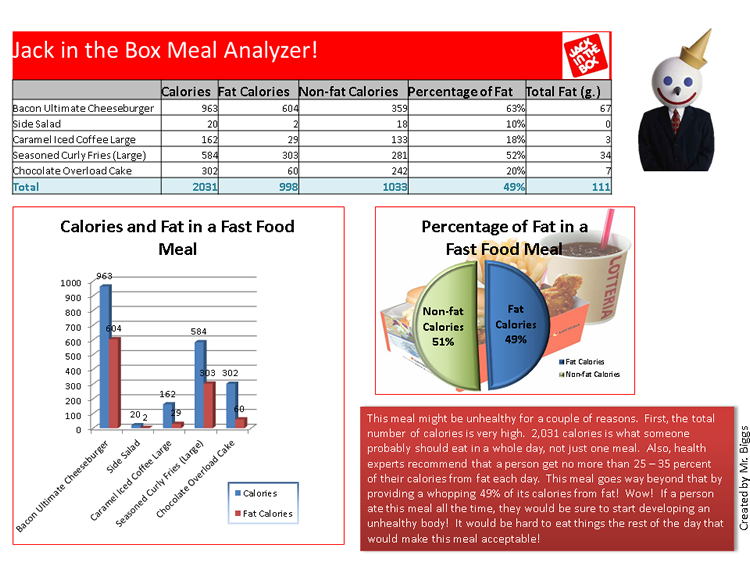
Click here to see a sample project created using the Jack in the Box menu.
Project Rubric
| Fast Food Fun | To earn a NI- you must complete the following: | To earn a NI you must complete the following: | To earn a S you must complete the following: | To earn an E you must complete the following: | ||||||||||||||||||||
|
|
|
|
|
||||||||||||||||||||
|
|
|
|
|
||||||||||||||||||||
|
|
|
|
|
||||||||||||||||||||
|
|
|
|
|
||||||||||||||||||||