

Introduction to Spreadsheets
Introduction
Spreadsheets are very powerful tools that allow you to accomplish many tasks easily. Spreadsheets let you:
- do extremely hard math problems quicker than you can blink your eyes (actually they can do thousands of math problems quicker than you can blink your eyes!)
- organize projects or tasks
- create and format lists
- understand huge amounts of data.
Spreadsheets can also be used to create models that simulate what happens in real life which allows you to study and understand problems to help find a solution. Without the spreadsheet we might not have personal computers today. It was the spreadsheet that made people understand that personal computers were indespensible and caused them to start buying them by the thousands way back in 1980!
Parts of a Spreadsheet
Before you can start using a spreadsheet, there are just a few key things you need to learn. And because all spreadsheets work alike, once you've learned these, you'll be able to use ANY spreadsheet successfully!
Click here to study the PARTS OF A SPREADSHEET! When you are finished, print the Certificate of Completion and put in in your Tech Journal.
Enter Data
Now that you understand the parts of a spreadsheet and can find them on the screen, we'll start entering data in a spreadsheet you create.
![]() First, watch the video that explains how to enter data in a spreadsheet.
First, watch the video that explains how to enter data in a spreadsheet.
Now that you know all about entering data, it it time for you to create your first spreadsheet! Follow the directions below to create your first spreadsheet!
- Open Microsoft Excel by clicking the Windows button --> All Programs --> then scroll if necessary to find the Microsoft Office folder --> then click on Excel (the GREEN icon).
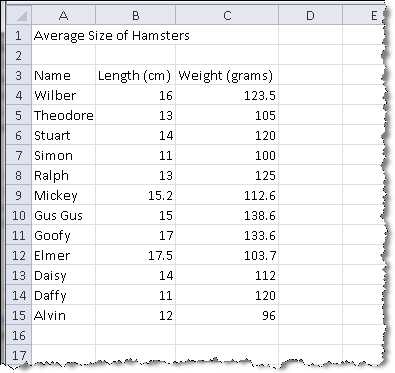
- Create a spreadsheet using this data.
- Save your spreadsheet in a folder in your Documents folder. Call it Hamster Data.
- Print a copy of your spreadsheet and put it in your Tech Journal.
Formatting Data
Entering data in a spreadsheet is pretty easy if you had a plan to start with. However, if you want people to read your spreadsheet easily, you'll want to add some formatting to help them out. We'll learn to change the format of text, cells, columns and rows to make it easy to understand the data in your spreadsheet.
![]() Complete this tutorial and print out the Certificate of Completion when you finish. Put the certificate in your Tech Journal.
Complete this tutorial and print out the Certificate of Completion when you finish. Put the certificate in your Tech Journal.
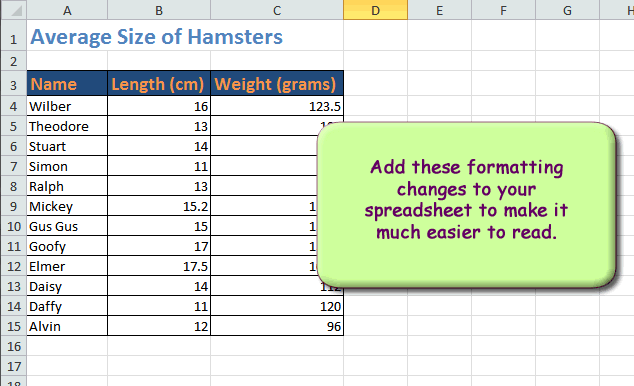
Now you are ready to complete your own formatting in your Hamster Data spreadsheet using this picture as a guide, format your Hamster Data spreadsheet to look exactly like the one in the picture.
Print a copy of your formatted spreadsheet (even though it is in black and white, and place it in your Tech Journal.
Formulas and Functions
The real power of any spreadsheet is using formulas to allow the computer to do the arithmetic for you! In this exercise, you'll learn to use spreadsheets to help you do a few ordinary Math problems with record speed!
Listen closely as Mr. Biggs explains how to use each function and formula to make hard Math problems easy and fun!
We'll use a ready made spreadsheet for this activity. Click here to download the practice spreadsheet.
Creating Charts
Charts bring data to life! Spreadsheets and charts go together like peanut butter and jelly!! In this section you'll first learn how to create a chart quickly from your data. Then I will show you how to format the chart to make it attractive and easy to read!
Start by completing this ![]() tutorial on Creating a Chart in a Microsoft Excel Spreadsheet. Print out your score sheet at the end and give it to your teacher.
tutorial on Creating a Chart in a Microsoft Excel Spreadsheet. Print out your score sheet at the end and give it to your teacher.
Next, open your Hamster Data spreadsheet and create a column chart that shows the weight of the hamsters (like the second example in the tutorial). Print out your chart and give it to your teacher. Be sure to save your spreadsheet!
Now you are ready to learn to format a chart! This is where it gets really fun.
Start by completing this ![]() tutorial on Formatting Charts in Microsoft Excel Spreadsheets. Print out the certificate of completion at the end and give it to your teacher.
tutorial on Formatting Charts in Microsoft Excel Spreadsheets. Print out the certificate of completion at the end and give it to your teacher.
Now you are ready to format a chart on your own.
Open your Hamster Data spreadsheet. Using the Hamster Weight chart you created above, change the following in your chart:
- Change the Title to "Hamster Weight in grams".
- Change the chart WALL to a gradient color.
- Change the color of a column.
- Change the background of your chart.
- Change the font of the data labels on the left side and the bottom (the names)
- EXTRA CREDIT: Use a picture from the Internet to create a pictograph as shown in the tutorial.
When you have completed formatting your chart, print it out and give it to your teacher
Final Project: Fast Food Fun
Prove your prowess at spreadsheets as you complete the Fast Food Fun project!!